The U.S. Energy Information Administration (EIA) released its Electric Power Monthly report on July 23, 2026, with data through May 31. The numbers mark a structural shift in the American electricity mix: renewables — including hydropower, wind, solar, biomass, and geothermal — generated 30.3% of total U.S. electrical output during the first five months of 2026, up from 28.2% in the same period of 2025.
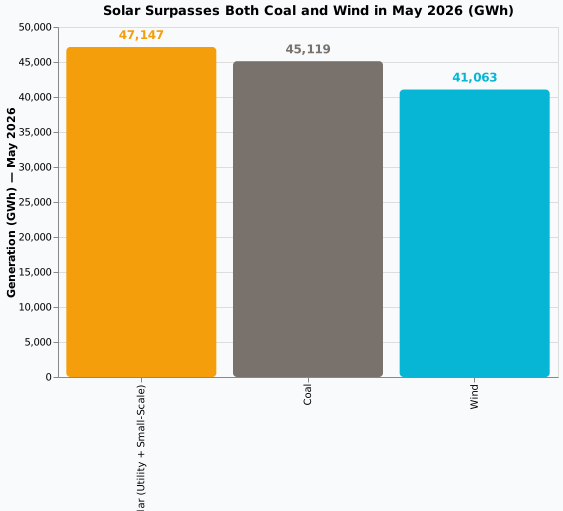
The headline number: In May 2026 alone, solar-generated electricity (47,147 GWh) exceeded both coal (45,119 GWh) and wind (41,063 GWh) — the first month in U.S. history where solar has simultaneously surpassed both of those sources. Combined wind and solar, including small-scale distributed systems, produced 22.2% of all U.S. electricity in the January–May period.
Contents
- The Numbers: Generation by Source, January–May 2026
- Solar in May: What the Milestone Means
- Capacity Additions: 61.3 GW of Clean Energy in 12 Months
- Battery Storage Trajectory: 23 GW Expected by Mid-2027
- Coal and Nuclear Continue Their Decline
- Forward Look: 37% Renewable Capacity by 2027
- Simulation Implications for Energy Modelers
- Sources
The Numbers: Generation by Source, January–May 2026
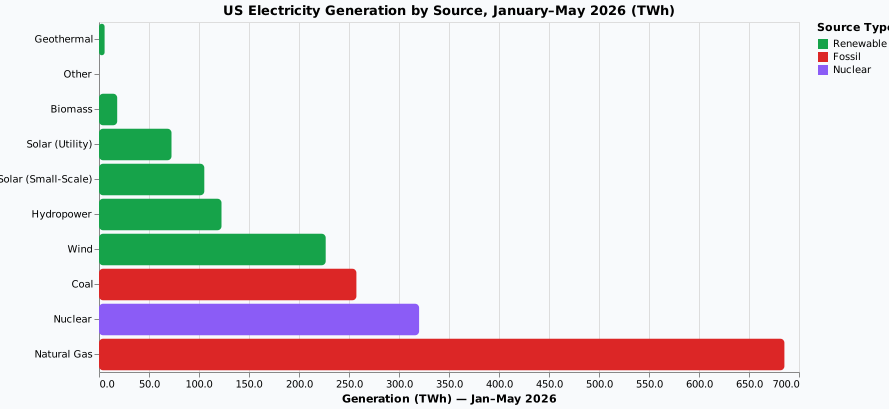
Total U.S. electricity generation in the first five months of 2026 was approximately 1,813 TWh. The fuel mix tells a clear story of renewable displacement:
| Source | Generation (TWh) | Share of Total | YoY Change |
|---|---|---|---|
| Natural Gas | 685.4 | 37.8% | +2.5% |
| Nuclear | 320.1 | 17.7% | +1.3% |
| Coal | 257.4 | 14.2% | -10.9% |
| Wind | 226.7 | 12.5% | +7.2% |
| Small-Scale Solar | 105.3 | 5.8% | +21.6% |
| Hydropower | 122.5 | 6.7% | +4.1% |
| Utility Solar | 72.5 | 4.0% | +21.6% |
| Biomass + Geothermal + Other | 23.8 | 1.3% | -0.5% |
Renewable generation grew 10.1% year-over-year, led by utility-scale solar (up 21.6%) and small-scale distributed solar (also up 21.6%). The 404 TWh generated by wind and solar combined was 57% more than coal's 257 TWh and 26% above nuclear's 320 TWh. Natural gas remains the largest single source at 37.8%, but its growth rate of 2.5% is far below that of wind and solar, according to data compiled by the SUN DAY Campaign from EIA figures.
Solar in May: What the Milestone Means
May 2026 was a watershed month for American solar energy. Utility-scale and small-scale solar combined generated 47,147 GWh, exceeding coal's 45,119 GWh and wind's 41,063 GWh. This is the first month in which solar has outperformed both legacy sources simultaneously.
Several factors converged to drive this result. The EIA's monthly data reflects increasing solar capacity deployment in 2025 and early 2026, combined with the seasonal peak in solar irradiance during the Northern Hemisphere spring. Average capacity factors for utility-scale PV in May typically range from 22% to 28% across the U.S. Southwest, compared to winter averages of 15–18%. The spring shoulder season also tends to suppress natural gas demand for heating and cooling, creating more room for solar in the dispatch order.
This trend mirrors what California and Texas have experienced at a state level. The EIA noted in May 2026 that solar generation in ERCOT could exceed coal for the first time on an annual basis in 2026, a milestone that now appears virtually certain given the year-to-date data. California has operated with solar exceeding 40% of instantaneous demand on a routine basis since 2023.
What matters for project developers and energy modelers: the solar generation milestone reflects both capacity additions and capacity factor improvements. The 27,995 MW of utility-scale solar added in the 12 months through May 2026 is the largest single-technology capacity addition of any source — more than wind, gas, and battery storage individually.
Capacity Additions: 61.3 GW of Clean Energy in 12 Months
Between June 1, 2025 and May 31, 2026, the United States added a total of 53,666 MW of utility-scale renewable capacity (solar, wind, hydropower, biomass, and geothermal). Including small-scale solar's estimated 6,664 MW of new distributed capacity, the total clean energy addition was approximately 60,330 MW. When adding the 23,241 MW of battery storage capacity added or planned for commissioning in the same window, the combined clean energy + storage buildout approaches 84 GW.
To put that in perspective: the 53.7 GW of utility-scale renewable additions is 41% higher than the 38.0 GW added in the preceding 12-month period (June 2024–May 2025), according to EIA data. The acceleration is visible across every clean technology category.
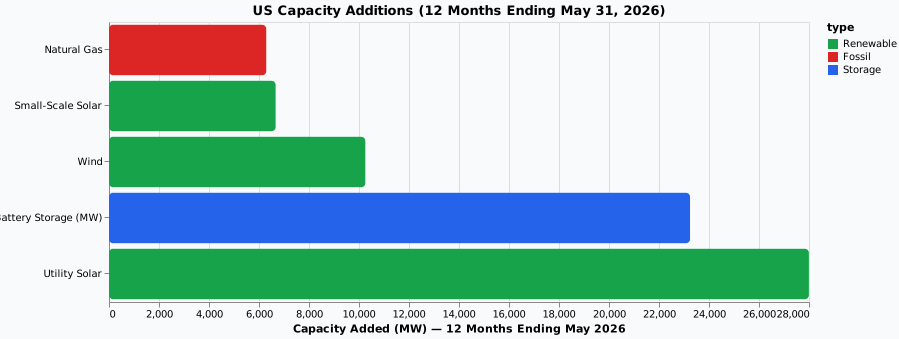
Key ratio to watch: The ratio of solar capacity additions to wind additions has shifted from roughly 1.5:1 in 2023–2024 to approximately 2.7:1 in the current 12-month window. This reflects both the relative ease of solar permitting and interconnection compared to wind, and the impact of the Inflation Reduction Act's investment tax credit (ITC) for standalone solar and solar-plus-storage.
Battery Storage Trajectory: 23 GW Expected by Mid-2027
Battery energy storage merits its own discussion. The EIA projects 23,241 MW of new battery storage capacity will be added by June 1, 2027 — a 48% increase from the approximately 48,761 MW of installed BESS capacity as of May 31, 2026. This would bring total U.S. BESS capacity to approximately 72,000 MW within the next 12 months.
According to Wood Mackenzie's U.S. Energy Storage Monitor (Q2 2026), the U.S. energy storage market deployed a quarterly record of approximately 10 GWh in Q1 2026, driven primarily by utility-scale front-of-meter installations. The average utility-scale BESS duration continues to drift upward — from 2.1 hours in 2020 to approximately 3.7 hours for systems commissioned in Q1 2026.
For comparison, the 23 GW of BESS expected by mid-2027 would make battery storage roughly equivalent to 7–8% of total U.S. generating capacity, up from approximately 5% today. This trajectory has implications for every aspect of grid modeling: reserve margins, frequency response requirements, renewable curtailment rates, and the economic viability of gas peaker plants.
The Solar Energy Industries Association (SEIA) reported that U.S. energy storage installations hit a Q1 record, up 32% year-over-year. The combination of falling battery pack prices — BloombergNEF reported LFP pack prices below $55/kWh in 2025 and sub-$45/kWh by early 2026 — and the accelerating retirement of coal plants (net 2,236 MW of coal capacity retired in the past 12 months) is creating a structural demand for short-duration and medium-duration storage capacity.
Coal and Nuclear Continue Their Decline
Coal generation fell 10.9% year-over-year in the January–May period, reaching 257.4 TWh — its lowest level for this period since EIA records began. Coal capacity also declined by a net 2,236 MW over the rolling 12 months. The remaining U.S. coal fleet, at approximately 177 GW, is operating at an average capacity factor below 35%, down from over 60% a decade ago, according to EIA data.
Nuclear generation was essentially flat at +1.3%, reflecting the absence of new reactor additions and the scheduled refueling and maintenance outages that characterize spring operations. Nuclear capacity declined by a net 27.6 MW over the 12-month period. The Department of Energy's Office of Nuclear Energy has been actively supporting extended operations at existing plants, but no new large-scale nuclear capacity is expected online before 2030 at the earliest.
Coal-to-gas and coal-to-solar switching is the dominant dynamic in the U.S. power sector. The combination of low natural gas prices (Henry Hub averaging approximately $2.50/MMBtu in H1 2026) and the zero-marginal-cost operation of solar and wind creates a dispatch stack where coal is increasingly the marginal source being displaced. This pattern is most pronounced in the PJM, MISO, and SPP regions, where wind and solar penetration has grown rapidly.
Forward Look: 37% Renewable Capacity by 2027
The EIA's capacity projections through May 2027 show continued acceleration. Renewable energy's share of total U.S. utility-scale generating capacity is forecast to grow from 34.1% as of May 31, 2026 to 37.0% by May 31, 2027. Utility-scale solar alone is expected to add 43,972 MW over this period, expanding its share from 13.1% to 16.1%.
Wind capacity is projected to grow by 9,426 MW, while battery storage adds 23,241 MW. Including estimated small-scale solar additions of approximately 6,000 MW, total renewable generating capacity would reach approximately 542 GW by June 1, 2027. By comparison, natural gas generating capacity would total approximately 515 GW. While nameplate capacity is not the same as dispatchable firm capacity, the crossover point — where renewable capacity surpasses natural gas capacity — is approaching within the next 12–18 months.
This has direct implications for capacity market design and resource adequacy assessments. As the EIA Annual Energy Outlook 2026 notes, the growing share of variable renewable capacity changes the effective load-carrying capability (ELCC) calculations that operators use to set reserve margins. Solar's ELCC declines from approximately 50% at low penetration to below 20% at the penetration levels now being reached in California and Texas, making battery storage — with its high ELCC — structurally more valuable for capacity accreditation.
Simulation Implications for Energy Modelers
For developers and consultants modeling utility-scale PV, wind, or hybrid projects in the U.S. market, the May 2026 EIA data reinforces several modeling best practices:
Solar-plus-storage is the default configuration. With battery pack prices below $45/kWh and BESS capacity growing at 48% annually, the economics of standalone solar are becoming less competitive than solar-plus-storage for new interconnection requests. Energy Optima's platform supports LP-optimized BESS capacity sizing that accounts for the specific solar resource, PPA structure, and battery degradation profile of each project — the kind of granular simulation needed to optimize co-located systems as BESS penetration grows.
Duration assumptions must keep pace. The average utility-scale BESS duration has shifted from 2 hours to 3.7 hours in just six years. Projects modeled with a default 2-hour or 4-hour assumption may systematically misstate revenue. The EMS dispatch strategy used to operate the battery matters more at longer durations because the optimal charge/discharge schedule across a full day of solar generation has more degrees of freedom.
Capacity accreditation matters for revenue modeling. As renewable penetration crosses the 30% threshold, ELCC-based capacity revenue becomes an increasingly important component of project returns. Models that assume a flat capacity payment without modeling the hour-by-hour correlation between renewable output and system peak demand will overstate capacity revenue by 15–30%. Energy Optima's dispatch simulation module captures this by running the full 8,760-hour resource adequacy calculation against system load data.
Coal retirements create BESS deployment opportunities. With 2.2 GW of coal retirements in the past 12 months and an accelerating pipeline, interconnection points at retiring coal plants are among the most valuable sites for BESS deployment — they offer existing transmission capacity, available land, and nearby load centers. Simulating the interconnection capacity and ramp-rate requirements of a coal-to-BESS conversion requires site-specific load flow analysis that Energy Optima's battery storage simulation supports through configurable AC bus voltage, transformer impedance, and point-of-connection parameters.
The U.S. electricity mix is changing faster than most models capture. The 30% renewable generation threshold — once projected for 2030 under optimistic scenarios — has been reached four years early. For energy modelers, the May 2026 EIA data is not just a milestone to report. It is an input parameter that changes the shape of the residual load curve, the optimal storage duration, and the competitive landscape for every new project entering interconnection queues today.
Sources
- U.S. Energy Information Administration — Electric Power Monthly (July 23, 2026, data through May 2026)
- CleanTechnica — "Renewables Provide More Than 30% of US Electricity" (July 23, 2026)
- Electrek — "Solar generated more electricity than coal and wind in May – EIA data" (July 24, 2026)
- Renewables Now — "Renewables and battery storage added 61.3 GW in US during past year" (July 24, 2026)
- Wood Mackenzie — U.S. Energy Storage Monitor Q2 2026 and Latin America Energy Storage Outlook
- BloombergNEF — Battery Price Survey 2025 and 1H 2026 Energy Storage Outlook
- Solar Energy Industries Association (SEIA) — U.S. Energy Storage Installations Q1 2026 Record
- EIA Today in Energy — "Solar to surpass coal in Texas power generation in 2026" (May 13, 2026)
- EIA — Annual Energy Outlook 2026
Model U.S. Market Scenarios in Energy Optima
Energy Optima's simulation platform supports 8,760-hour PV, wind, BESS, and hybrid system modeling with LP-optimized capacity sizing, manufacturer-specific battery degradation from real cell data, and 25-year financial projections (NPV, IRR, LCOE). Import EIA generation data, configure your PPA structure, and find the optimal project configuration for any U.S. market.
Create Free Account