From Configuration to Bankable Results
Energy Optima guides you through a complete project workflow: configure your system, run physics-based simulations, and generate investment-grade deliverables that close deals.
Choose Your Path
Whether you're running feasibility studies, designing systems for construction, or evaluating investment returns, Energy Optima adapts to how you work.
Feasibility & Advisory
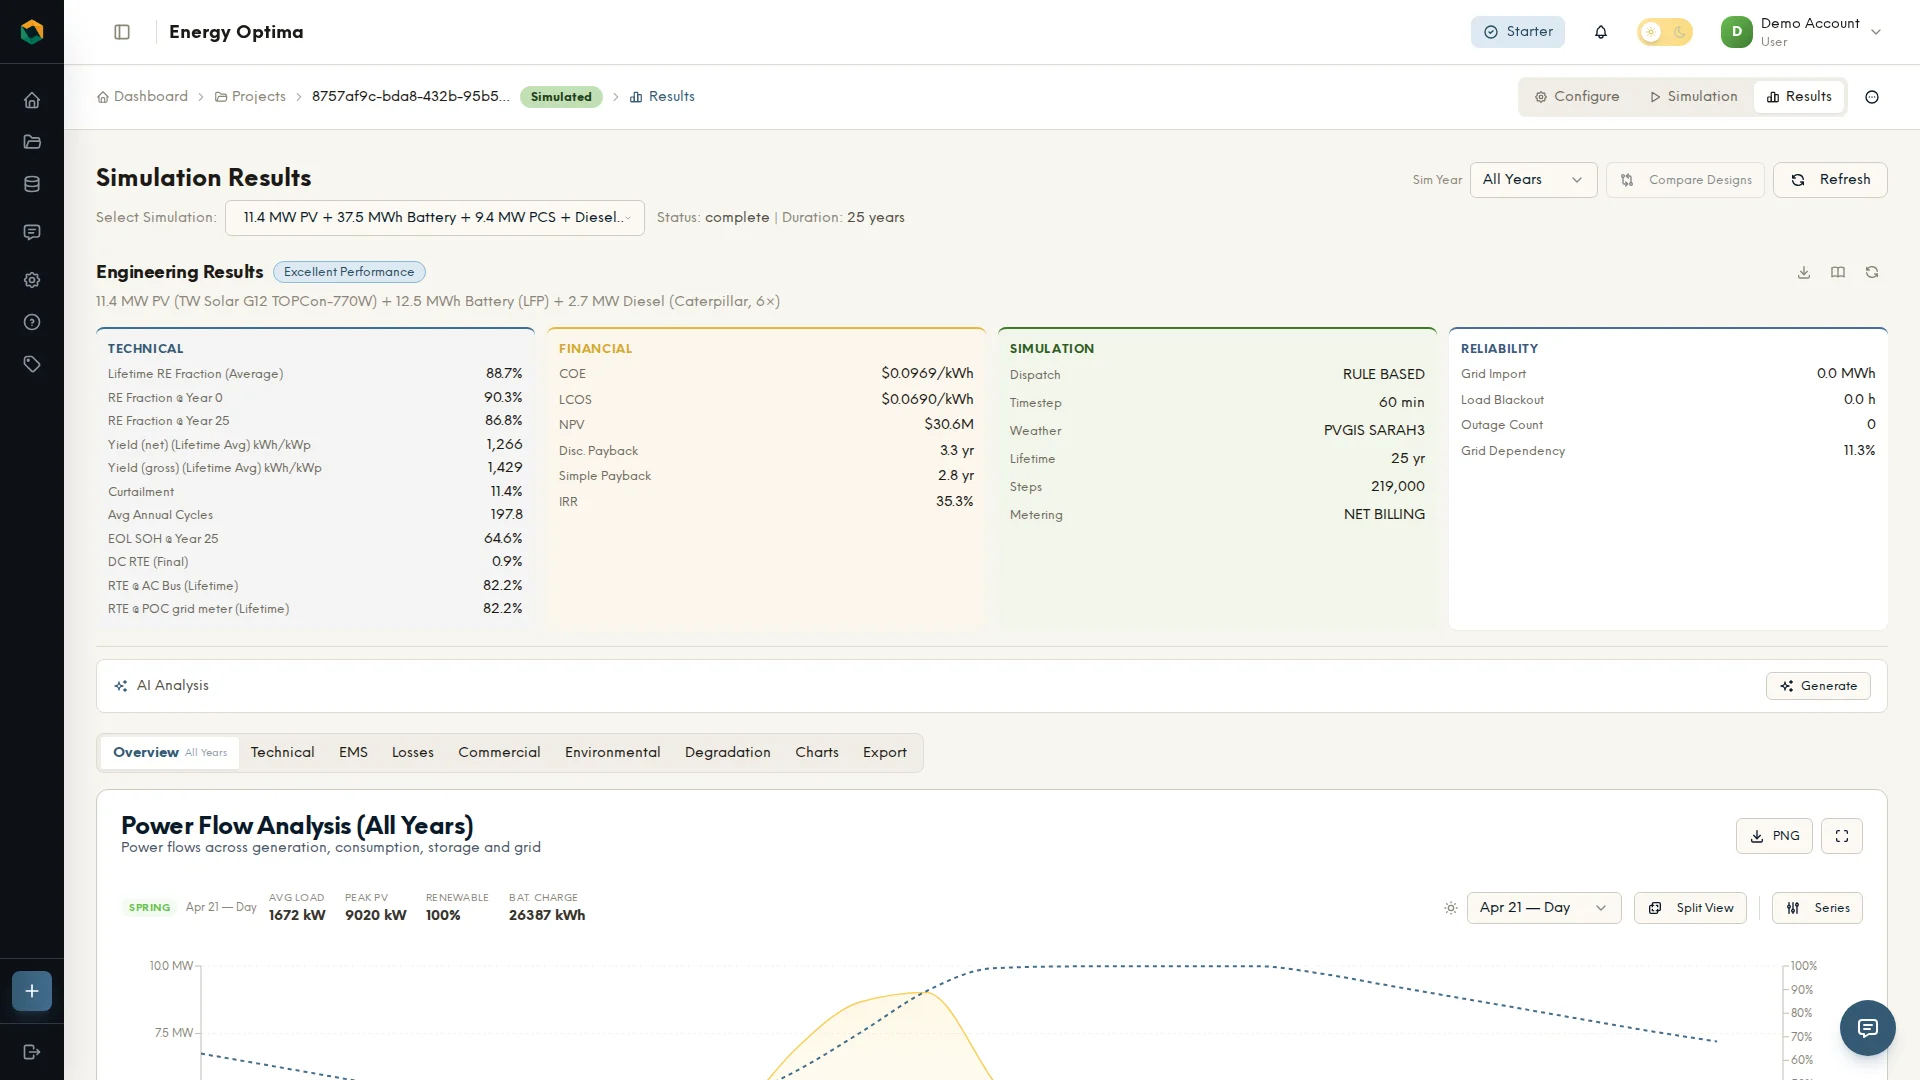
Rapid Scenario Analysis
Run multiple configurations in parallel. Compare battery chemistries, PV sizes, and dispatch strategies side-by-side. Generate client-ready reports in minutes.
- Multi-scenario comparison dashboards
- White-label PDF/Excel reports
- Per-project pricing model
- Sensitivity analysis on key variables
Engineering & Construction
Engineering-Grade Precision
Design systems that match construction reality. Component-level specifications, IEC-compliant loss calculations, and handoff-ready documentation for procurement.
- Real manufacturer component database
- IEC 61724 loss waterfall compliance
- Bill of quantities export
- Performance guarantee modeling
Investment & Development
Investment-Ready Outputs
Generate financials that satisfy due diligence. NPV, IRR, LCOE with NREL methodology. Cash flows that match what lenders and equity investors expect to see.
- NREL-compliant financial metrics
- 30-year degradation-adjusted cash flows
- Bankable project documentation
- Portfolio-level analysis
Four Steps to Bankable Results
Every project follows the same rigorous methodology, from initial configuration to investor-ready deliverables.
Configure
Select components from our manufacturer database. Set location, load profile, and tariff structure.
Simulate
Run hourly physics-based simulation with 3 dispatch strategies. 8,760 timesteps per year, up to 50-year project life.
Analyze
Review technical KPIs (yield, PR, capacity factor) and financial metrics (NPV, IRR, LCOE).
Deliver
Export in 5 formats — Word, Excel, PDF, PowerPoint, CSV. Generate audience-tailored reports. White-label ready for your clients. Access via API.
Under the Hood
For engineers who want to understand the methodology. Click each module to see the technical approach.
Manufacturer-Specific Degradation
We don't use generic degradation curves. Each of our battery models includes extensive manufacturer degradation data covering SOH and RTE across multiple C-rates (0.25C, 0.33C, 0.5C) and cycle frequencies over 26 years. 3D linear interpolation finds exact values for your operating conditions.
Chemistry-specific aging: LFP, NMC, NCA, and NAS each behave differently. Calendar aging and cyclic aging are modeled separately. Temperature-dependent auxiliary power (HVAC, BMS) is included.

SOH and RTE degradation tracking with 3D interpolation
IEC 61724 Loss Waterfall
10-stage loss chain following industry standards. Each loss is independently configurable: soiling, shading (near/far), temperature derating, mismatch, DC cabling, inverter efficiency curves, AC cabling, transformer, availability, and annual degradation.
PVWatts methodology with NOCT temperature corrections. Weather data from PVGIS TMY (1994-2022) for global coverage. Validated against NREL SAM within 2% for typical configurations.

10-stage loss waterfall with configurable parameters
NREL-Compliant Economics
Financial metrics calculated following NREL SAM methodology. NPV, IRR, LCOE, LCOS, and payback on post-tax nominal cash flows. Degradation impact on revenue is automatically included year-over-year.
Cost modeling includes CAPEX (equipment, BOS, EPC), OPEX (O&M, insurance, land), component replacement schedules, and salvage value. Revenue streams: energy arbitrage, demand charge reduction, grid services, PPAs.
Comprehensive financial metrics and cash flow analysis
Two Dispatch Strategies
EMS Dispatch & Optimization coordinates PV, battery, grid, and backup diesel generation. Two strategies for different project needs: Rule-Based priority dispatch for reliability-first systems, and Economic LP dispatch for TOU arbitrage, demand charge reduction, and limited export optimization.
Grid modeling includes TOU tariffs, demand charges, tiered pricing, net metering, and import/export asymmetry. Reliability modeling with SAIDI/SAIFI grid outage simulation and automatic islanded detection. Load profiles from built-in templates or custom CSV upload. Voltage and frequency compliance monitoring.

Multi-source dispatch with grid tariff optimization
Built Different
We built Energy Optima because existing tools weren't good enough for real projects.
Real Data, Not Assumptions
Every battery and PV module in our database has real manufacturer data. No generic degradation curves. No estimated efficiency values. If we don't have the data, we don't guess.
Bankable Methodology
NREL-compliant financial calculations. IEC 61724 loss chains. When your lender asks how LCOE was calculated, you have a defensible answer that matches industry standards.
Fast Enough for Real Work
30-year simulation in under 5 minutes. Iterate quickly during client calls. Run sensitivity analysis overnight. Speed that doesn't sacrifice accuracy.
Deliverables That Close Deals
Export to Excel with all calculations transparent. PDF reports with your branding. API access for integration. Outputs designed for what comes next: procurement, financing, construction.
Fits Your Stack
Connect to industry-standard data sources and export in formats your team already uses.
Weather Data
PVGIS for global coverage, NREL NSRDB for the Americas, with automatic source selection by location. Custom TMY upload (CSV, Excel, EPW, TMY).
Export Formats
Word, Excel, PDF, PowerPoint, and CSV. Audience-specific reports for engineers, investors, or owners. White-label with your branding.
REST API
212 endpoints for programmatic access. Run simulations, manage components, retrieve results. API keys with read/write tiers.
Ready to build your first project?
14-day free trial. Full platform access.
Create Free Account